

Skip to content
Tether
Products

The engine and the products it powers.

It starts with the data. Core Tether extracts building performance data from the systems you already run, and installs its own sensors where the data is missing. Better Buildings and MouldWatch put that engine to work.

From building data to decisions you can defend.

An A-grade commercial office tower at dusk with building-performance data read live across its glass facade.
One platform Building data in. Decisions and proof out.
verified saving
$148k/yr

Auckland CBD A-grade office, IPMVP Option C.

rating pathway
2.0 → 4.5

Mackersy Property, projected, no major capex.

bank network metered
Big 4

Utility, occupancy, and IEQ, every office and branch.

The product family

Three products, one engine underneath.

Choose the product that fits the decision in front of you.

A tablet showing a ranked performance plan beside a bound evidence report, with a city view at dusk.
The platform Sensors and data in. A ranked plan and certified proof out.

Core Tether

The engine

The data platform behind every Tether engagement. It extracts building performance data from the systems you run and the sensors we deploy, then turns it into outcomes your team can act on.

  • Data extraction Utility, IEQ, air quality, and occupancy data from existing systems or sensors we deploy.
  • One operating record Bills, meter data, BMS history, and site context pulled into one structured record.
  • Performance outcomes A ranked plan for the money, risk, rating headroom, and proof, with confidence levels.
  • Certification NABERSNZ, NABERS Energy, and GRESB from the same evidence.
Talk to us about Core Tether
An aerial dusk view of a commercial property portfolio across a city skyline. Coming September 2026
Coming September 2026 Rating headroom and the saving behind it, ranked building by building.

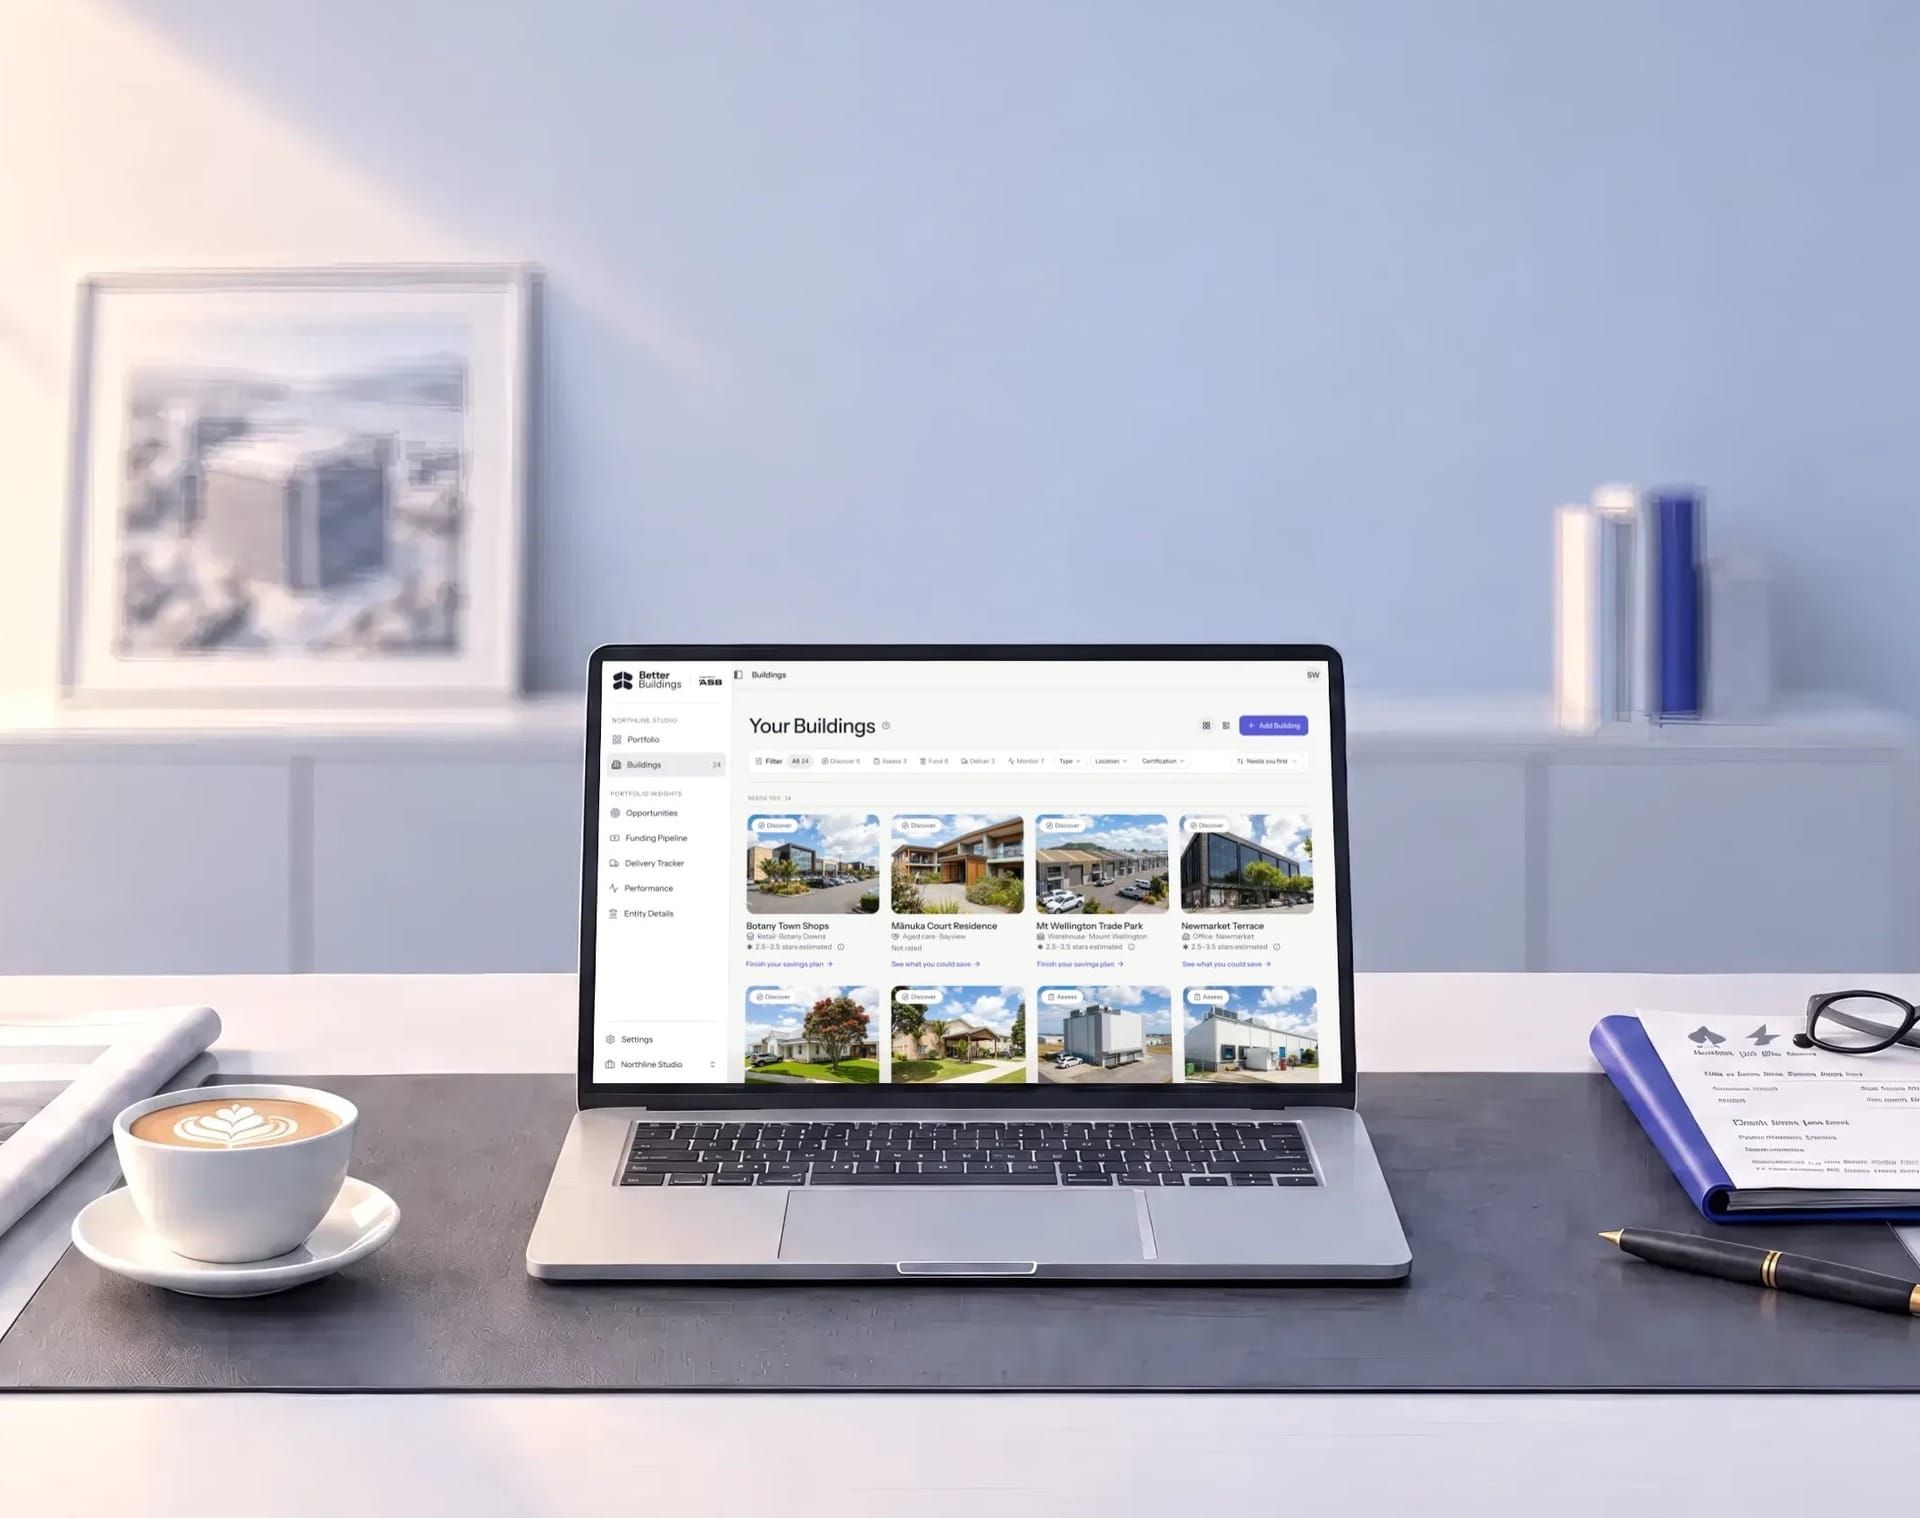
Better Buildings by Tether

Portfolio performance

For commercial portfolio operators. It ranks every building by rating headroom and the saving behind it, and tracks the work across the portfolio.

  • Built for portfolios Made for the fund managers, asset managers, and landlords who think across a whole portfolio.
  • In private development In private use with the first portfolios now, with a wider commercial launch this September.
Register your interest
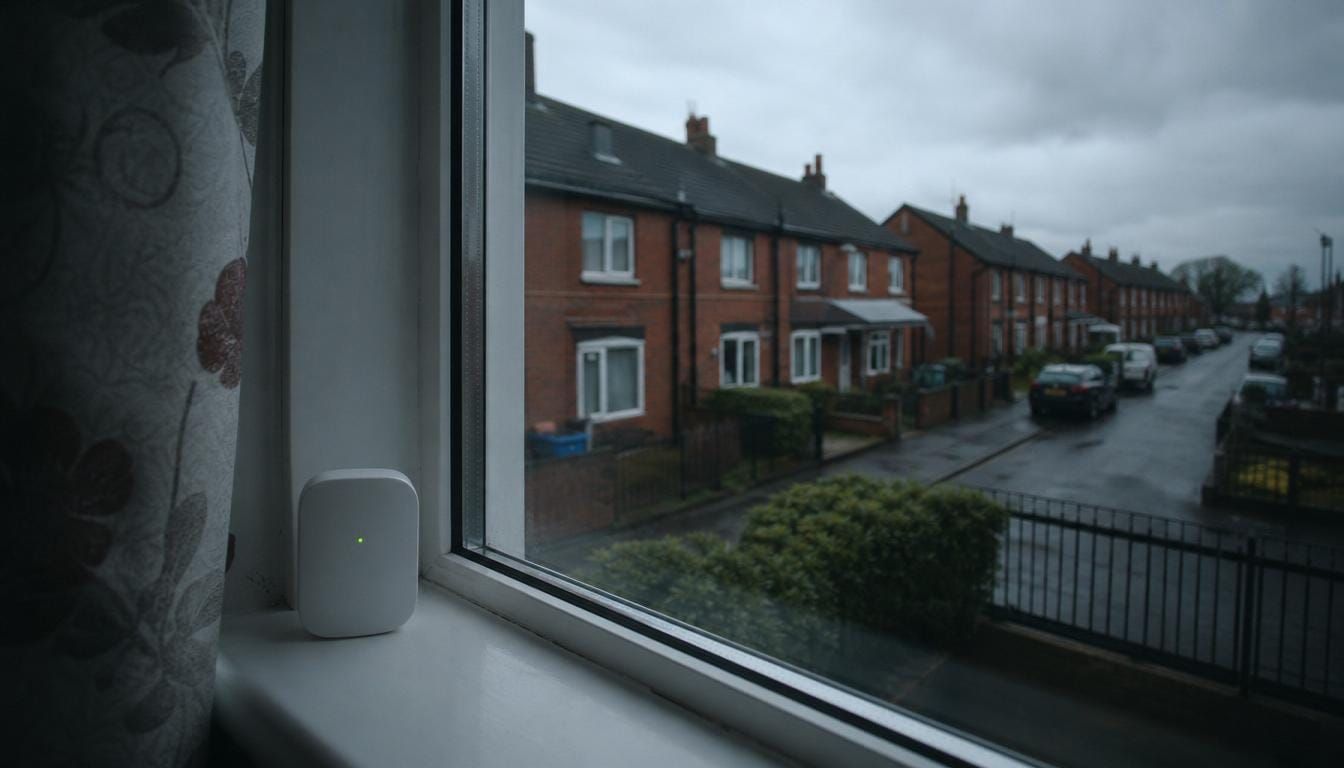
A row of UK social housing with a discreet damp-and-mould sensor on a windowsill.
Live in the UK From first sensor signal to a closed evidence pack.

MouldWatch by Tether

Damp and mould response

For UK social landlords and housing teams. Detect damp and mould risk early, respond inside statutory windows, and prove every step from first signal to remediation.

  • Early detection Sensors flag damp and mould risk in a home before the complaint escalates.
  • On the statutory clock Case workflow tied to Awaab's Law response windows, Decent Homes, and HHSRS.
  • A closed evidence pack First signal, investigation, remediation, and resident communication on one record.
Visit MouldWatch
Building performance data

Integrate or deploy. We get the data either way.

Tether specialises in building performance data extraction, and the approach is hardware agnostic: we plug into the systems you already run, and deploy the right sensors to fill the gaps, selected for the job and for any standard the outcome demands, including validated metering for a NABERS rating.

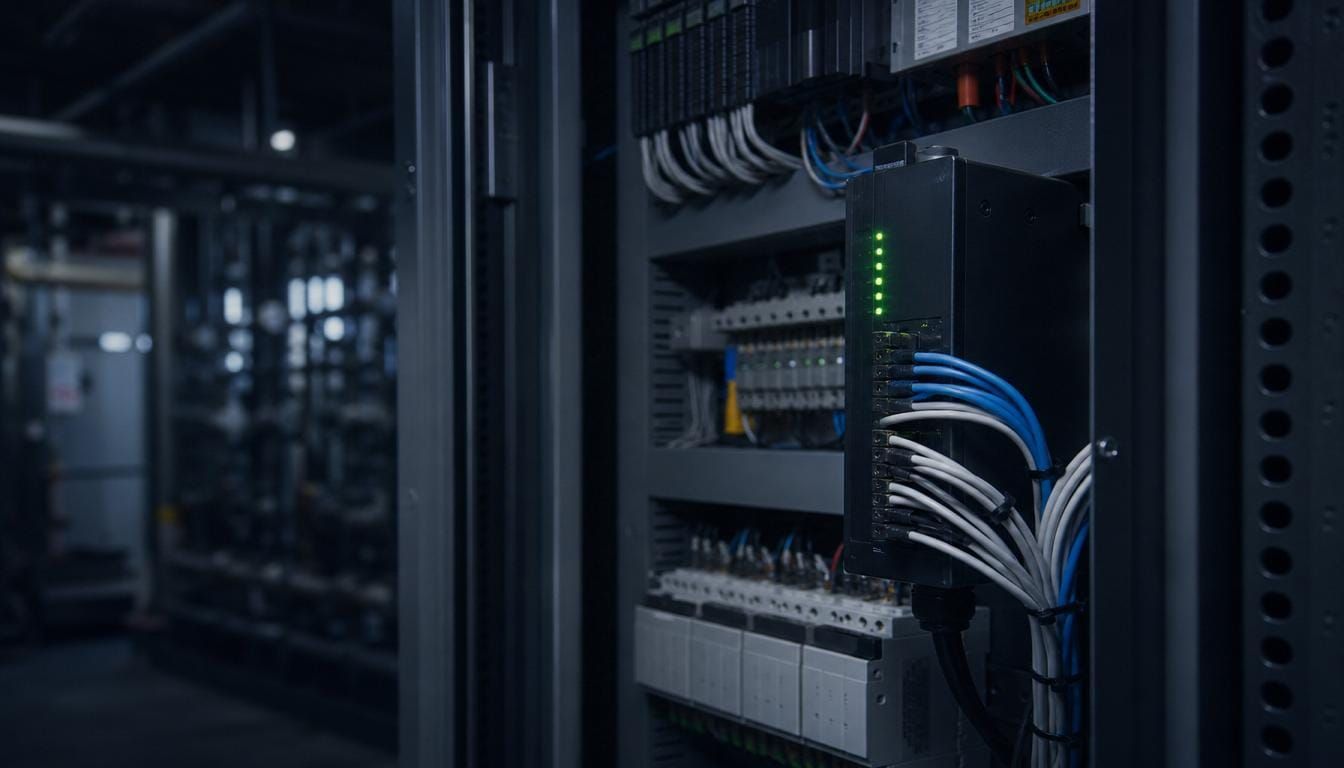
A building-management control cabinet with cabling plugged into a Tether data gateway. 01
Integrate

Into what you already run.

Meters, sub-meters, BMS, controllers, and existing sensors. We speak the protocols, networks, and data-transport layers, and pull every source into one clean record.

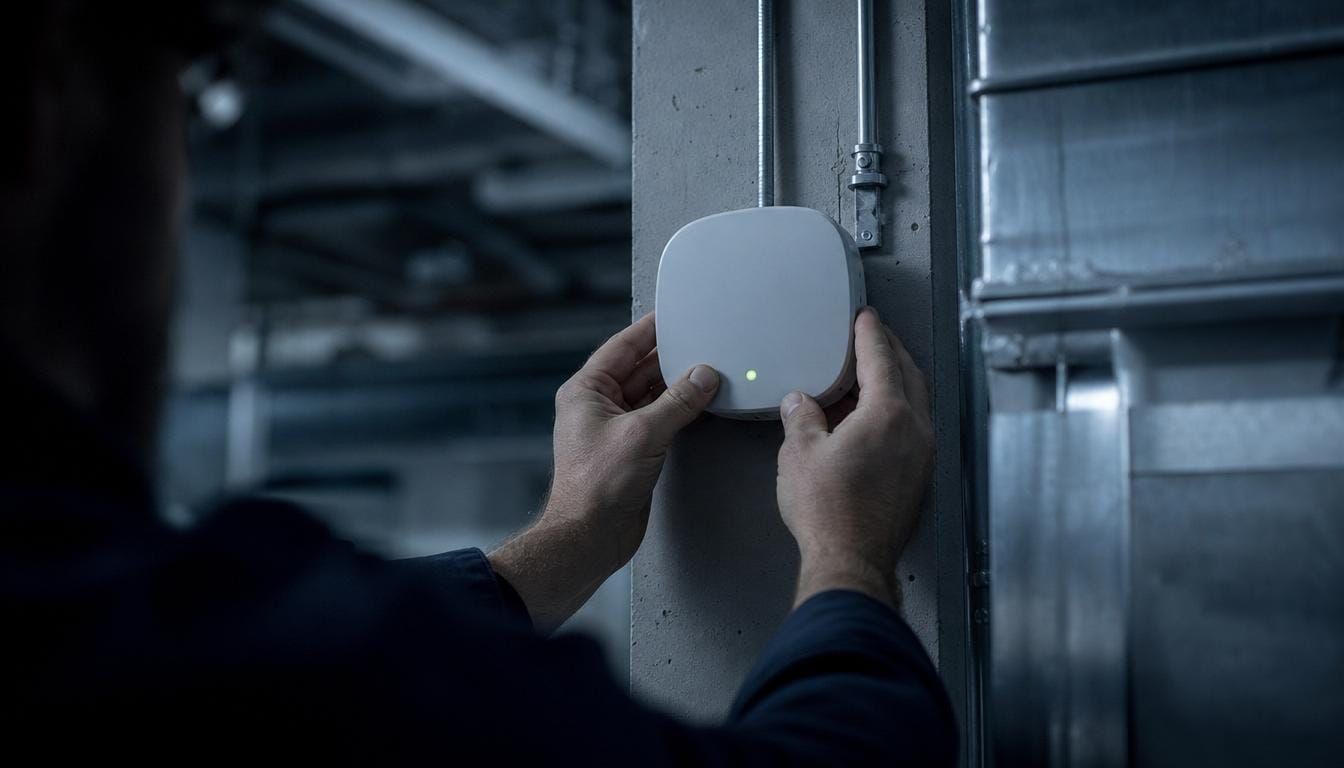
A technician mounting a Tether sensor on site. 02
Deploy

The right hardware, where the data is not.

Where the signal is missing, we install the right hardware, sized to the question, across utility sub-metering, indoor environment, air quality, and occupancy.

End to end

We own the whole chain.

From the sensor on the wall to the analysis on the page, every stage is ours, so we can show where every number came from.

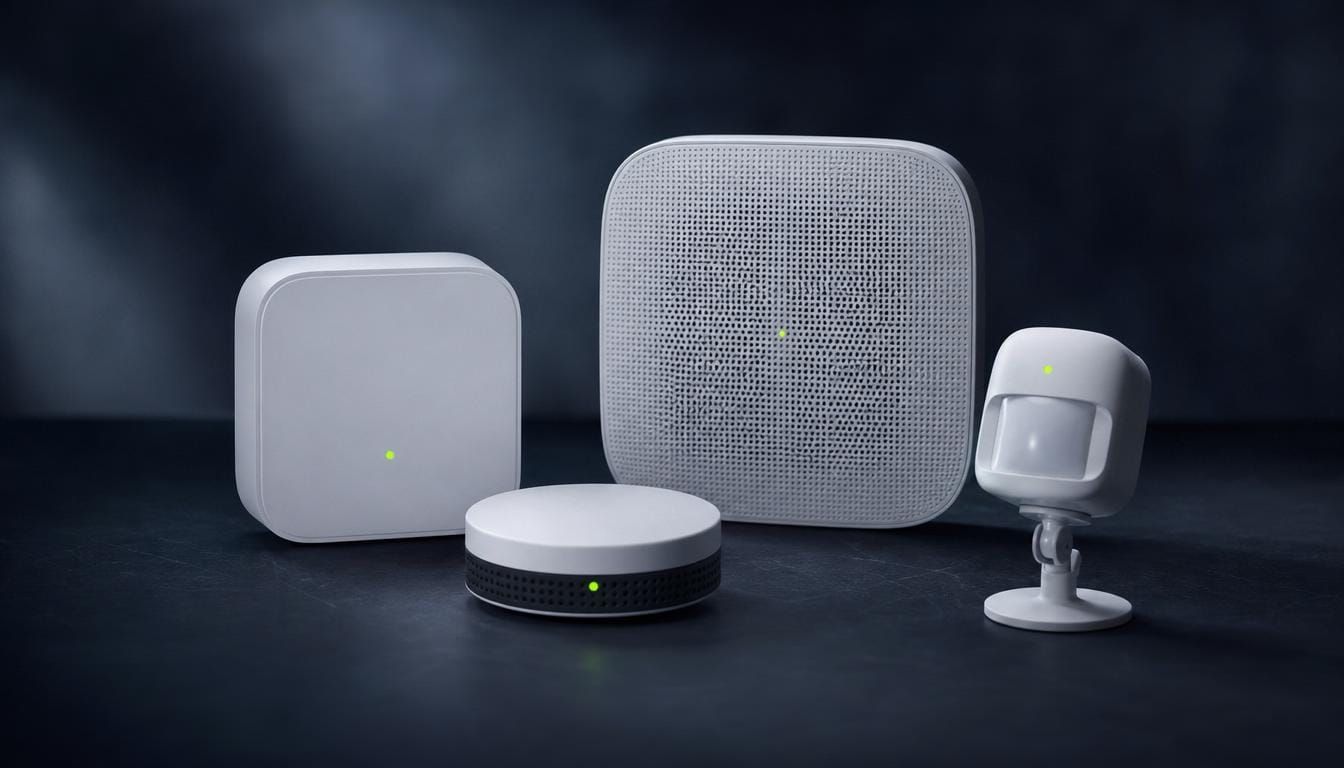
  1. A family of Tether building sensors arranged on a dark surface.
    01 / Sensors

    Hardware sized to the question.

    Utility sub-metering, indoor environment, air quality, and occupancy sensors, placed and calibrated to measure the loads that decide the bill, like after-hours running and chiller performance.

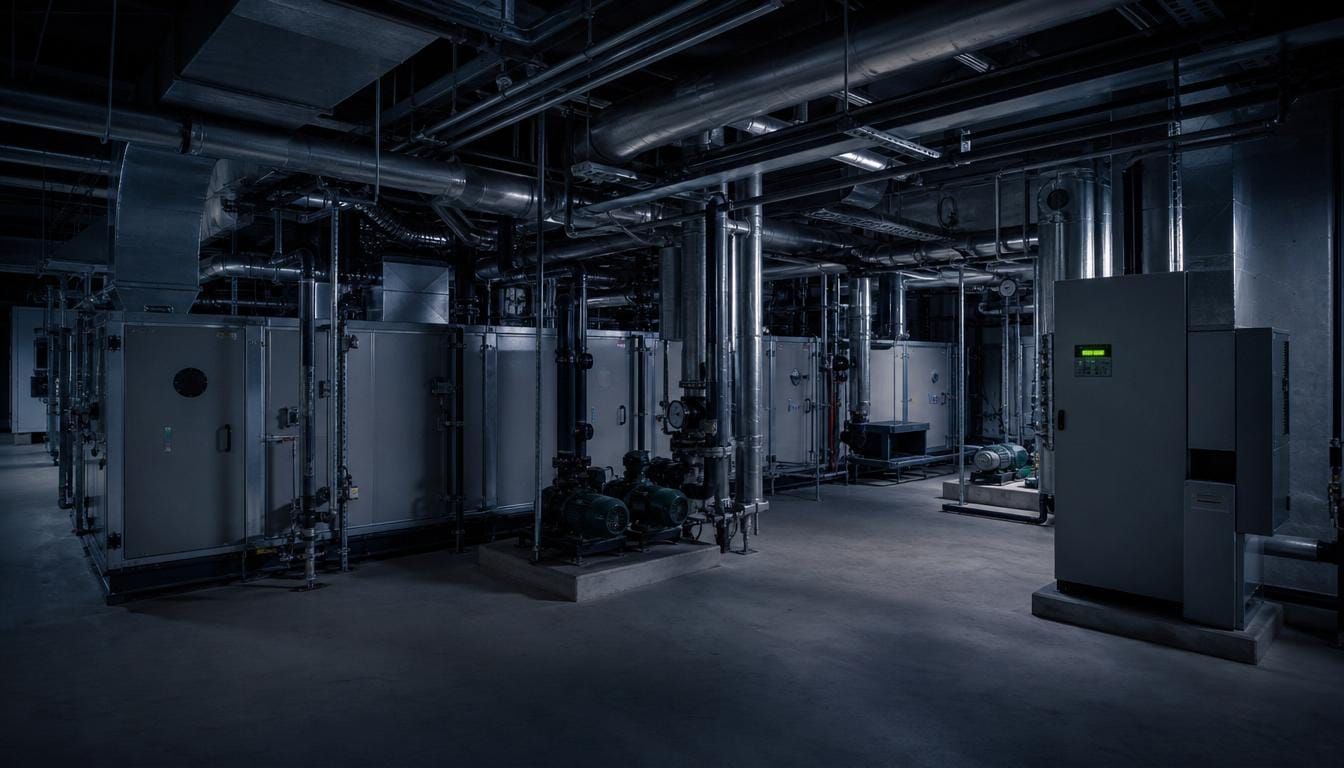
  2. A commercial plant room of mechanical systems and a building-management controller.
    02 / Systems

    The equipment already in place.

    Meters, BMS, controllers, and existing sensors become live data sources once they are connected.

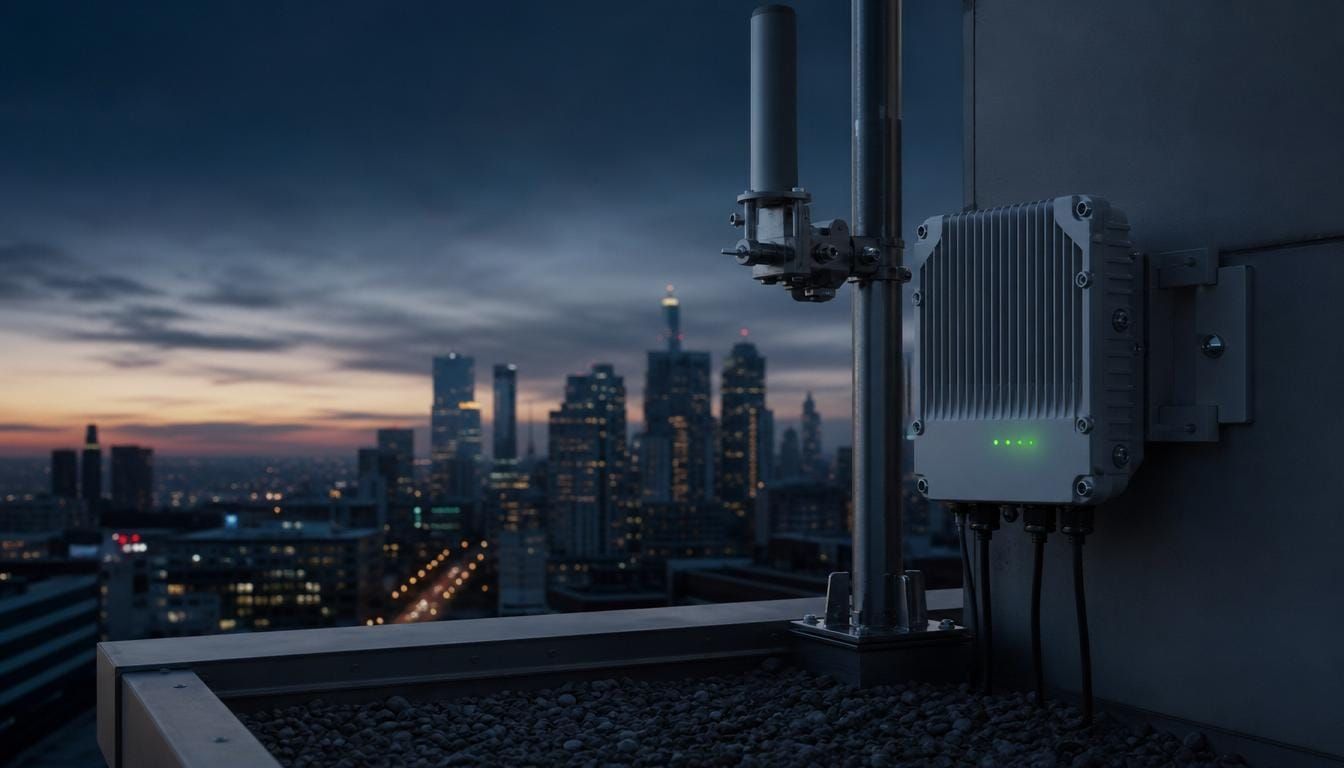
  3. A rooftop network gateway and antenna carrying building data off-site at dusk.
    03 / Networks

    Connectivity that holds in the real world.

    Resilient networks carry data out of plant rooms, basements, and across multi-site portfolios.

  4. Neatly loomed data cabling sweeping through a commercial building comms riser, one lime-green loom as the accent.
    04 / Data transport

    Every reading intact and attributable.

    Every reading is time-stamped and validated on the way in, so what lands on the platform is complete and traceable.

  5. Analyst reviewing a printed building performance report at a boardroom table in the evening.
    05 / Analysis

    Where data becomes a decision.

    One clean operating record becomes a ranked plan - the money, the rating headroom, the risk and the proof - each with a confidence level attached.

What we measure

The signals that run a building.

Three domains, one record. The utility, the indoor environment, and the people who use the space.

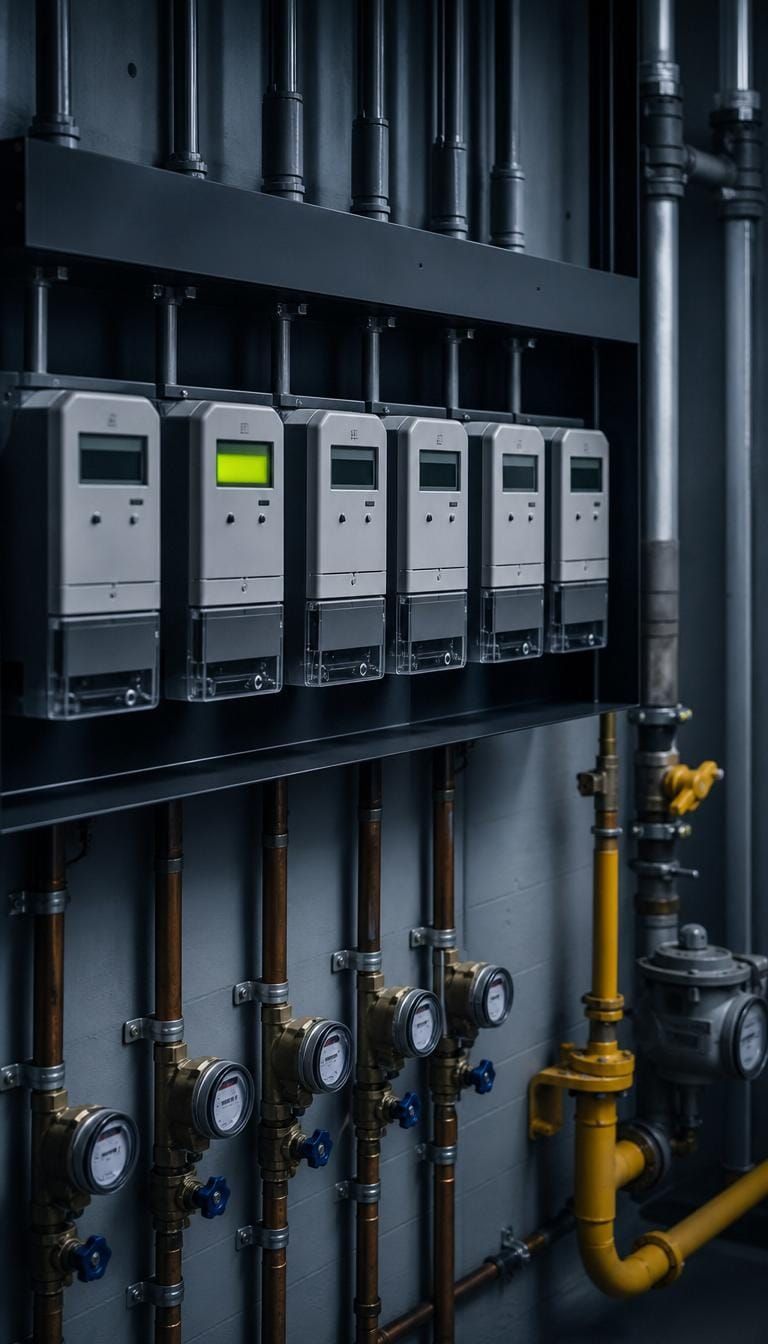
A commercial sub-metering board for energy, water and gas.
Energy, water, gas

Utility

  • Electricity, gas, and water
  • Whole-building and sub-meter
  • Demand, consumption, and cost
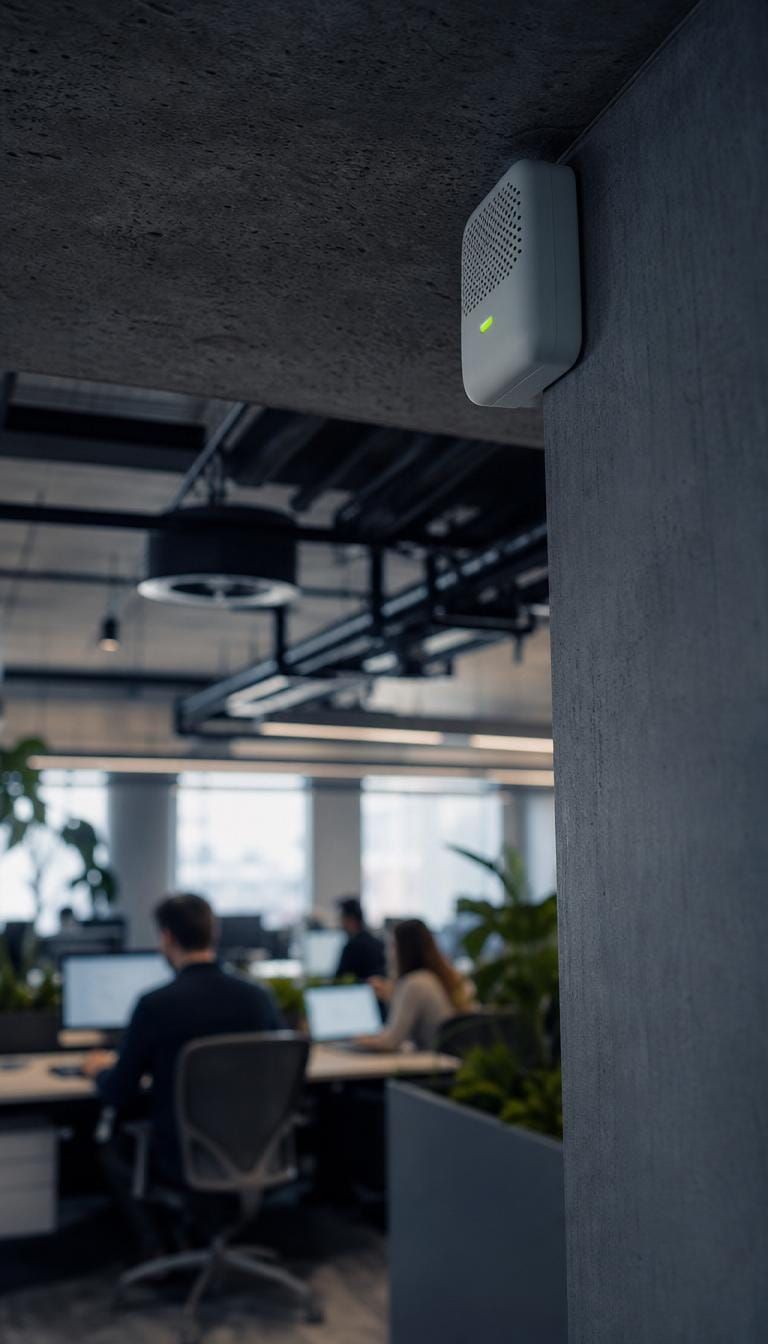
An indoor air-quality sensor in an occupied open-plan office.
Comfort, CO₂, particulates

IEQ and air quality

  • Temperature and humidity
  • CO₂ and particulates
  • Comfort and air quality
People moving through a modern commercial building atrium.
Presence, density, patterns

Occupancy

  • Presence and headcount
  • Density and utilisation
  • Patterns over time
What the data is for

Good data, pointed at a decision.

The same building performance data, put to work on the outcome you need.

A bound performance and ESG report beside a reporting dashboard at dusk.
01

Reporting

Auditable data for GRESB, ESG, board, and lender reporting, from one source of truth.

An analyst workspace showing multi-site building data across several screens.
02

Large studies

Portfolio and multi-site studies with consistent, comparable data across every asset.

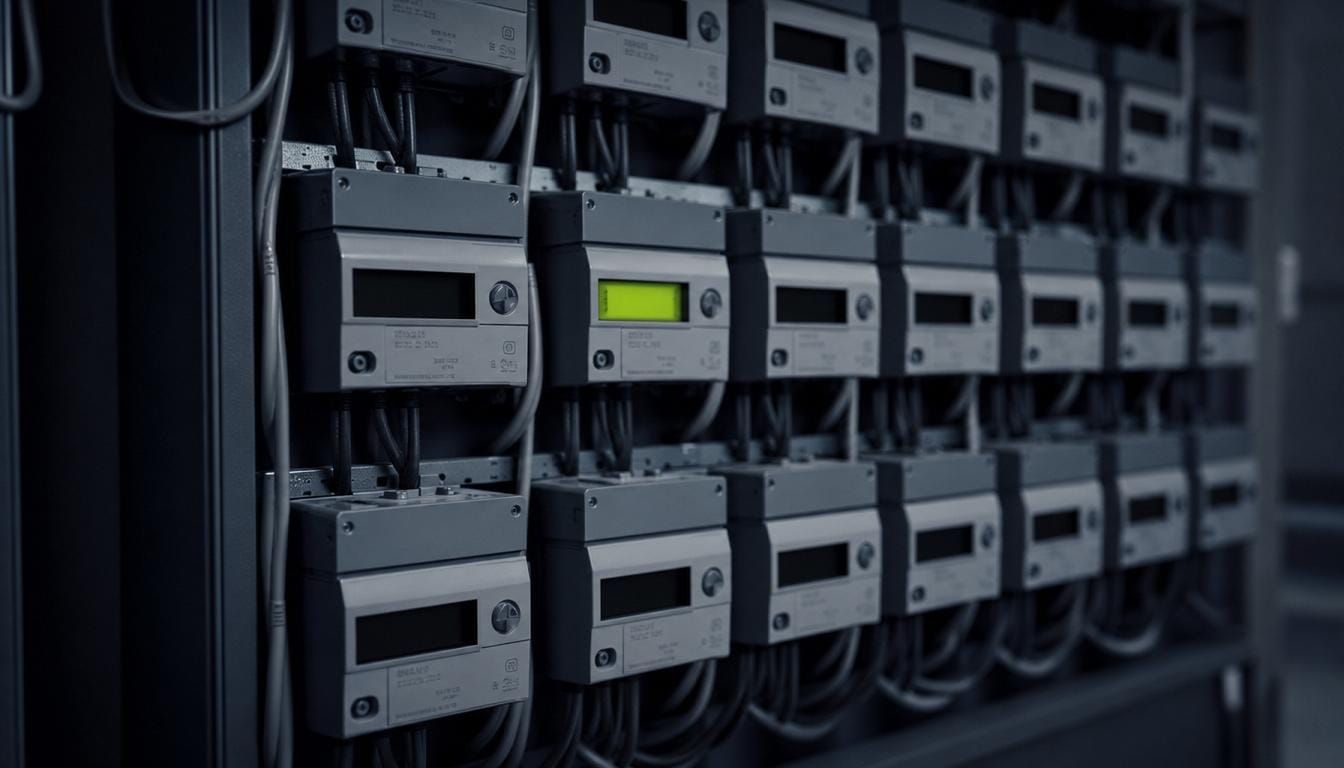
A dense bank of tenant electricity sub-meters in a commercial riser.
03

Sub-metering and sub-billing

Tenant-level metering and cost recovery, attributed accurately and defensibly.

A wall-mounted building air-quality and safety monitor in a corridor.
04

Health, safety, and risk

IEQ, air quality, and damp signals that protect people and limit liability.

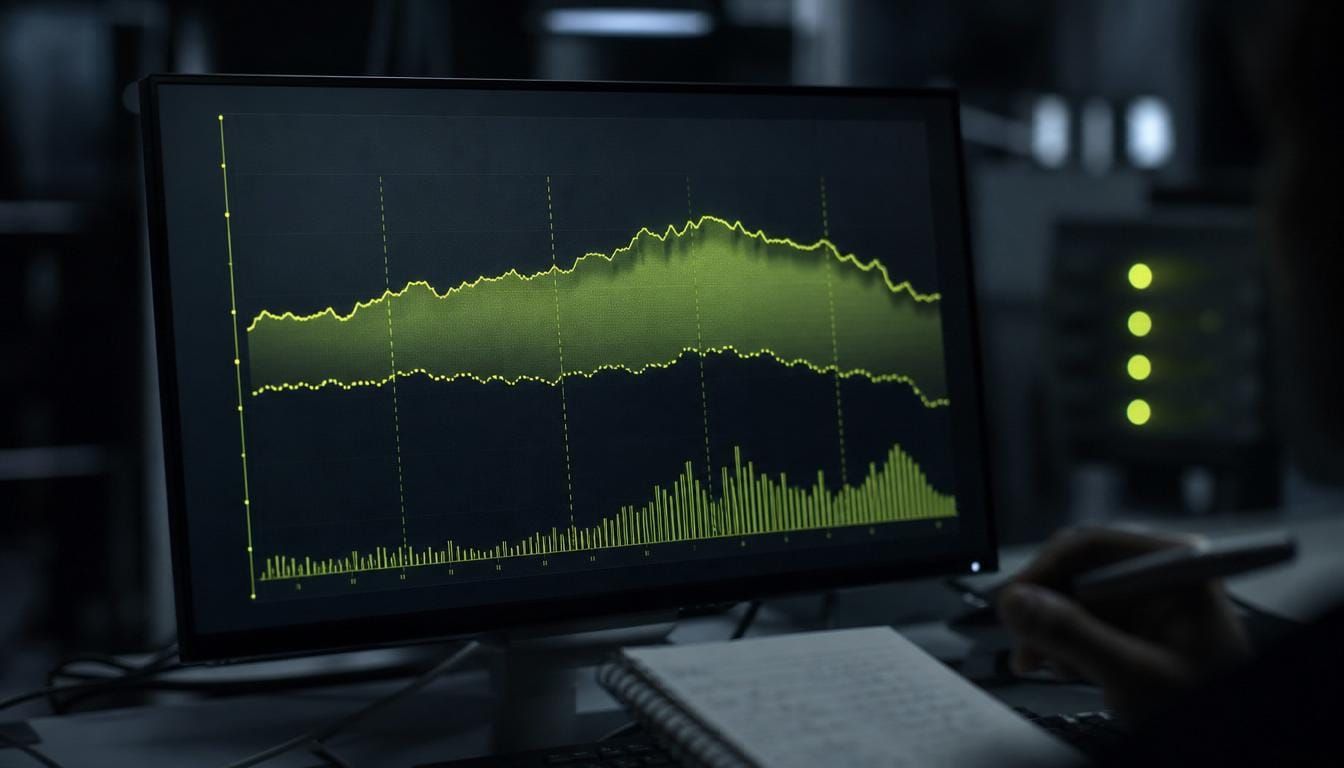
A measurement-and-verification baseline-versus-actual savings chart on a screen.
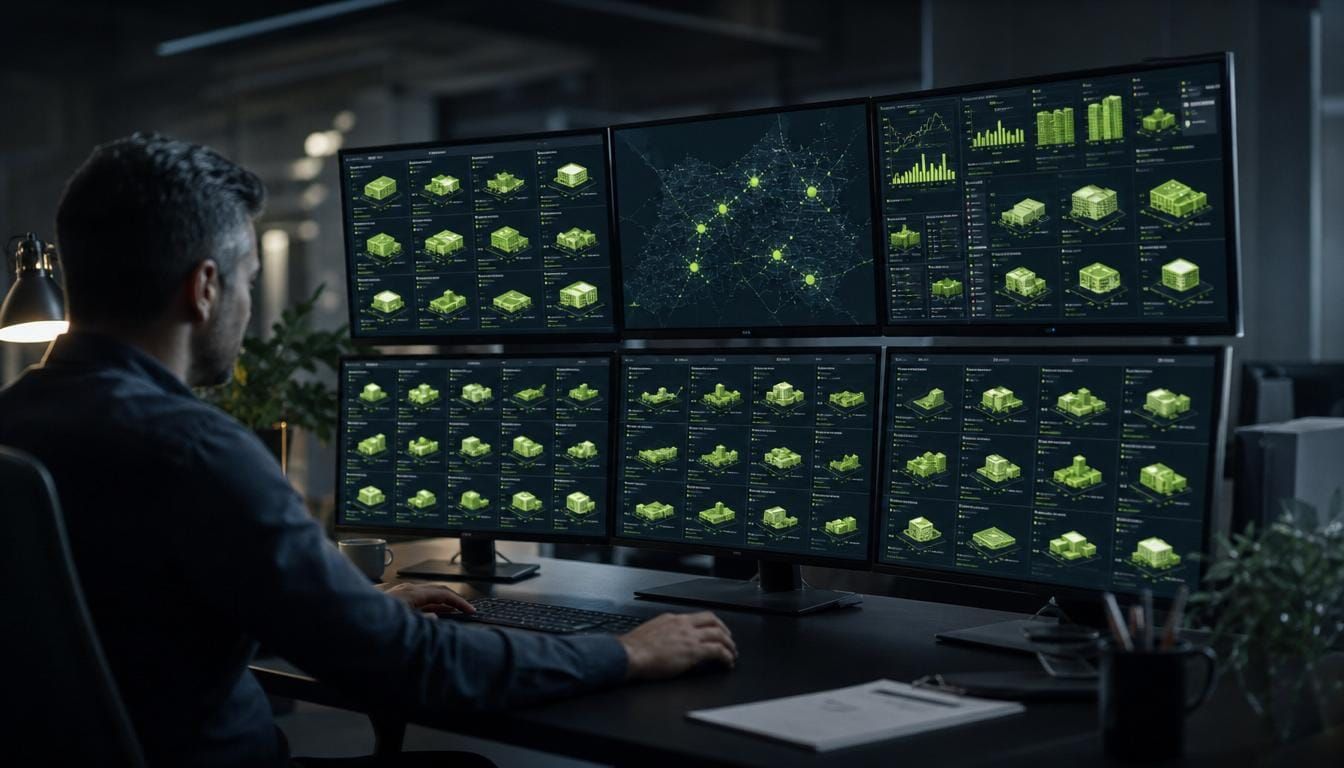
05

Measurement and verification

IPMVP-aligned baselines and verified savings that survive diligence.

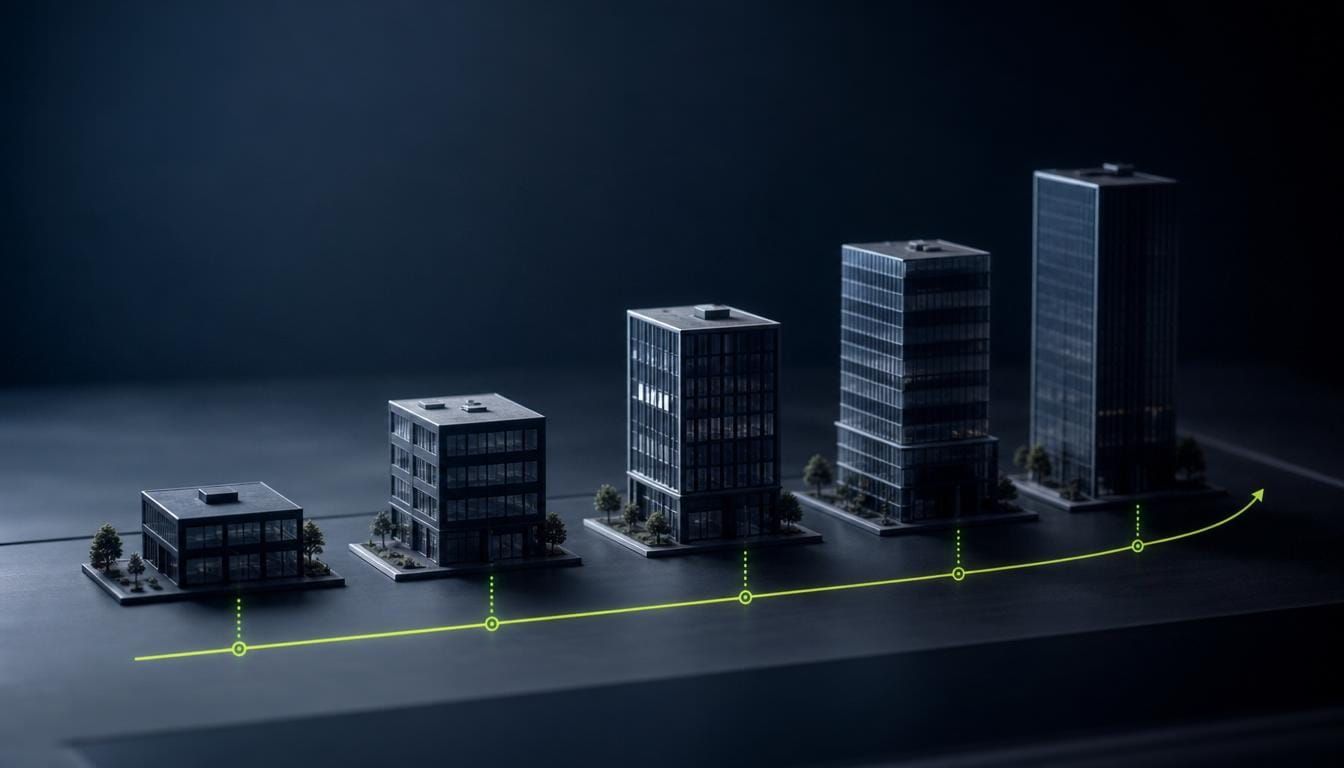
Commercial buildings ranked along a performance benchmarking scale.
06

Benchmarking

Compare assets to each other and to standards to find the headroom.

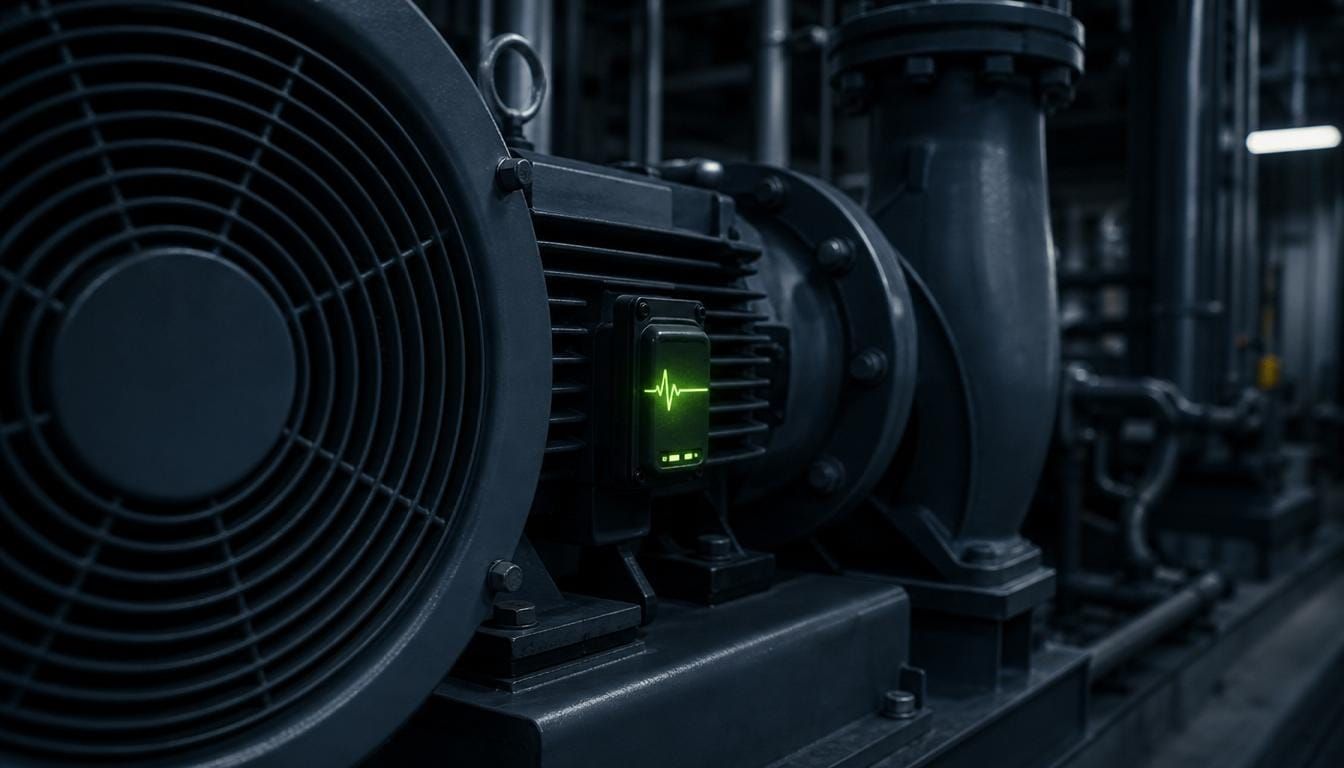
Large HVAC plant equipment with a health-signal indicator.
07

Predictive maintenance

Equipment and system signals that flag faults before they fail.

A building energy-rating plaque framed in a premium lobby.
08

Certification

The exact data NABERSNZ and NABERS Energy require, captured right the first time.

The next move

Start where the decision is.

One building or a whole portfolio, we scope the engine to the decision in front of you.